In this article, we examine energy price trends in Ireland and compare them to important comparator countries in Europe, including:
- Great Britain - through which much of Ireland's energy is imported and the proximity of which has implications for transport fuel tourism.
- Germany - the largest economy in Europe and one of its most successful.
- Poland - an example of a lower cost competitor economy for foreign direct investment.
- Denmark & Norway - small economies with significant indigenous petroleum resources.
Ireland's energy mix
Our analysis focusses on price trends for each of the three dominant 'fuels' in Ireland's energy mix, i.e. oil, natural gas and electricity. The prevalence of these is illustrated in the figure below, which shows how Ireland's energy consumption is split almost exactly in three between electricity, heating and transport.
Ireland's energy mix 2014 (image courtesy of SEAI)
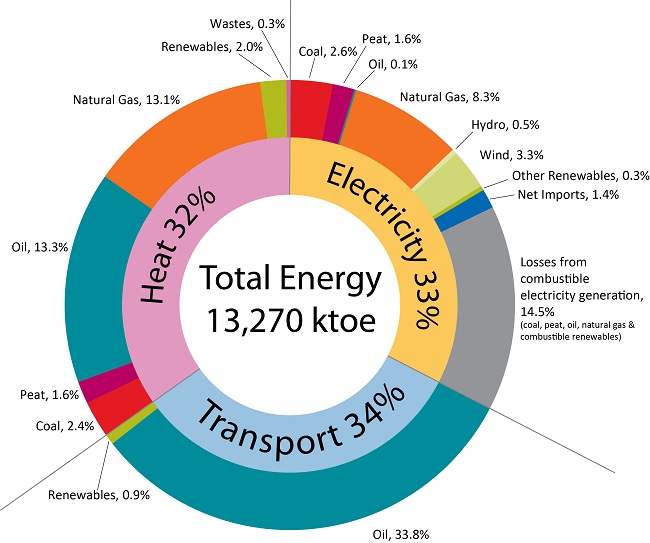
Despite the phasing out of oil from the power sector, oil products continue to meet well over half of Ireland's energy needs. Oil dominates the transport sector and meets two fifths of heating demand. Natural gas provides a similar amount of heating and is also the single most prevalent fuel in the electricity sector.
Crude oil
Crude oil prices have fluctuated significantly since 2000. From a peak of over $130 per barrel (€85, Brent crude) in the summer of 2008, prices dropped rapidly to just $40 in early 2009. Prices then rose steadily to reach over $120 (~€90) in Q1 2012, and they remained at or above $100 until 2014.
Crude oil prices 2000-2016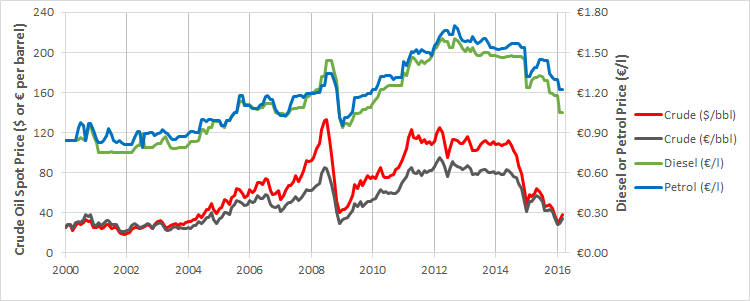
Since 2014, softening demand, abundant production from conventional sources and the continued growth of unconventional sources have caused prices to slide and led to record oil inventories over the recent winter months, during which time prices drifted well below $40. Prices have recovered somewhat over recent weeks - to $45.
These fluctuations shape energy prices globally. In Ireland, price variations for road transport fuels typically lag trends in the underlying crude oil price by about 3 months. This is illustrated in the green and blue lines above.
Road transport fuels
The table below summarises the pump prices for petrol and diesel for eight European countries, as collated by the Automobile Association. The prices include all taxes and levies.
Petrol & diesel prices (March 2016) (AA)
|
Fuel |
Irl |
GB |
Ger |
Pol |
Fra |
Bel |
Lux |
Nor |
Den |
|---|---|---|---|---|---|---|---|---|---|
|
Petrol (€/litre) |
1.22 |
1.32 |
1.21 | 0.93 | 1.25 | 1.28 | 1.04 | 1.45 | 1.42 |
|
Diesel (€/litre) |
1.05 |
1.32 |
1.03 |
0.86 |
1.13 |
1.14 |
0.89 |
1.30 |
1.19 |
These recent prices show that fuel is cheaper in Ireland than in France, Belgium, Britain, Denmark and Norway, and is very similarly priced to that in Germany. Interestingly, even though Norway has its own oil reserves and refining capacity, its diesel prices are among the highest in Europe. Ireland imports 100% of its mineral-oil-based transport fuels, either in the form of refined product or crude oil. Ironically, a significant proportion of the petrol and diesel used in Ireland is refined from Norwegian crude oil (see Ireland's energy flows here), yet diesel sold in Ireland is cheaper than it is in Norway. Denmark has also been self-sufficient in oil since 1993 and is projected to be a net exporter of oil out to 2021.
Polish prices are the lowest of the countries examined, while Luxembourg has significantly lower prices than its three neighbours. Some years ago, there were reports that Irish truck operators serving continental European markets were filling up in Luxembourg to benefit from much lower diesel prices. At the time, it was argued by industry representatives that this price differential reduced revenues for the Irish Government. Our latest analysis indicates that Luxembourg still retains a 15% price advantage compared to Ireland.
Natural gas
When comparing retail gas prices across Europe it is important to compare like with like in terms of the delivery period, tax regime and level of usage. It is also important to distinguish between recoverable and non-recoverable taxes, which vary from country to country.
With these caveats in mind, the graph below illustrates how Ireland’s gas prices to business compared with those in four other Member States over the period from July 2007 to December 2015. The usage band analysed was I3, which represents consumption of between 10,000 and 100,000 GJ/annum (approximately €120,000-€1,200,000 excluding VAT). The prices shown are exclusive of VAT and of other recoverable taxes and levies.
Natural gas prices (band I3) 2007-2015 (Eurostat)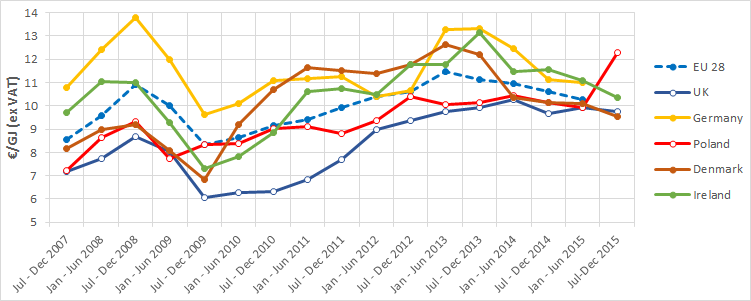
Ireland imported the vast majority of its natural gas from Britain over the period analysed so, unsurprisingly, prices in Ireland were higher than those in Britain and they remain so. Indeed, Ireland's location at the periphery of the European gas network also means that its wholesale prices are typically higher than those in mainland Europe. However, for most of the period, Ireland's (retail) prices were lower than those in Germany, although prices converged in recent years. The recent mild winter throughout Europe resulted in low gas demand and a significant reduction in wholesale prices, which contributed to lower retail prices in many countries, including Ireland.
Since 2011, prices in Ireland have been higher than the EU-28 average (see below) - peaking at 118% of the average in the second half of 2013, and moderating to 104-109% since then.
Ireland’s natural gas prices (band I3) as % of EU average 2007-2015 (Eurostat)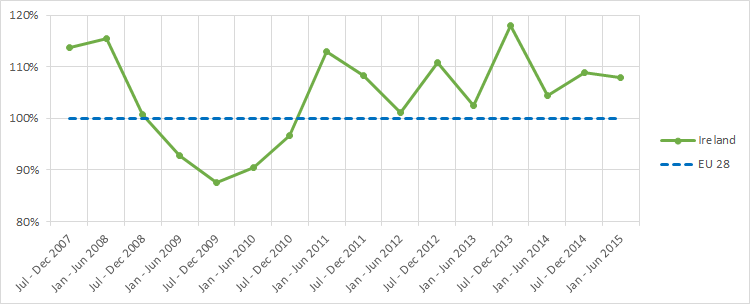
The Corrib field, which commenced commercial gas production at the end of 2015, will supply up to three quarters of the Republic of Ireland's demand during its first full year of production. Corrib's contribution to Ireland's energy security is likely to be more significant than its impact on retail gas prices.
Electricity
The graph below illustrates a similar comparison for business electricity prices. The ID usage band shown represents an annual consumption between 2,000 and 20,000 MWh (or approximately €240,000-€2,400,000 excluding VAT). The prices are exclusive of VAT and recoverable taxes and levies.
Electricity prices (band ID) 2007-2015 (Eurostat)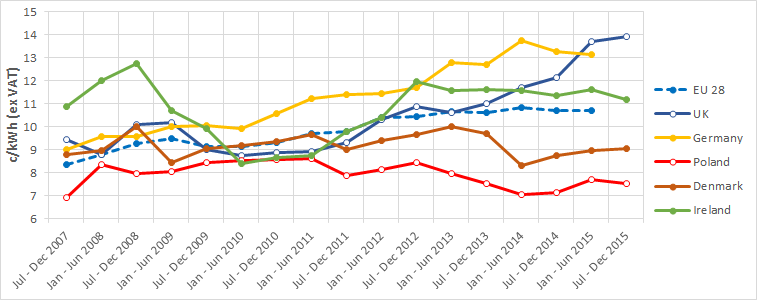
Electricity prices across Europe exhibit greater variance than gas prices do. This is due to significant differences in generation portfolios and in levels of (non-recoverable) taxes and charges paid by consumers. Prices for medium-to-large electricity users in Ireland (bands ID & IF, which account for almost two-thirds of the business market) were amongst the highest in Europe in the mid-late 2000s. Band ID prices dropped sharply over eighteen months from the second half of 2008, to below the EU-28 average, and then remained more-or-less static over three semesters before increasing steadily over the subsequent three semesters. Prices in Ireland have been between 106-110% of the EU-28 average since the beginning of 2013 (see graph below).
Ireland’s electricity prices (band ID) as % of EU average 2007-2015 (Eurostat)
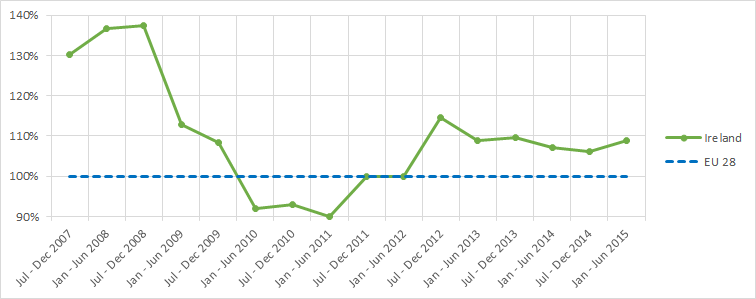
Over the period since 2013, Irish prices have decreased slightly (-3%), while the EU-28 average has remained stable.
The latest Irish prices are significantly lower than those in the UK (-20%) and Germany, but 9% higher than the EU-28 average and significantly higher than those in other northern European countries (e.g. Denmark +24%, Poland +49%).
Conclusion
Irish electricity and natural gas prices (for businesses) have been between 5-10% higher than EU-28 averages in recent years. Ireland's peripheral location in Europe impacts on wholesale gas prices, but the recent mild winter throughout Europe, among other factors, has contributed to decreases in gas (and oil) prices, including in Ireland. Although Ireland's electricity prices are among the highest in Europe, they are notably lower than those in Germany and Britain.
Ireland’s transport fuel prices compare favourably with many of the countries in our analysis. Changes in transport fuel prices lag variations in global crude oil prices by about three months.
Byrne Ó Cléirigh monitors energy prices on an ongoing basis as they have significant impacts on the competitive position of our clients and can be an important factor in investment decisions. Follow us on LinkedIn to ensure that you keep up to date with our latest insights in this area.
